

Our Services
As featured on:


What this includes:
-
Liaison and support to identify the most suitable way forward for what YOU need.
-
Building Forensics offers two core services:
-
Surveys to identify the contamination, from mould to over 30 possible triggers, its source, and cause and a report to outline the way forward.
-
Decontamination or risk reduction of mould and associated contamination to medically sound or internationally accepted standards
-
Comprehensive Treatment
We help people understand what’s making them or their property unwell, and what to do about it.
Building Forensics offers two core services: Mould treatment and Mould Decontamination. Each one is designed to give you clarity, control and a clear path to a healthier indoor environment.
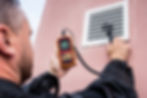
Mould Investigation
What We Do
We carry out detailed investigations to identify the source, type, and extent of contamination, including mould, bacteria, mycotoxins, endotoxins, VOCs, etc.
This non-invasive investigation assesses the indoor air quality and surface contamination levels and types, and results in a data-driven report.
The report is important to assist in your treatment and wellness route.

Who It's For
Our investigations support private homeowners, tenants, landlords, solicitors, and healthcare professionals.
We also provide expert witness services for legal proceedings and insurance claims.

Our Process
For any health improvement or treatment benefits to work, the cause of illness must be identified and removed or reduced.
Our core objective is to understand health issues, link them to a possible problem, determine their cause, and remove or reduce them.

Visual assessment and detailed site inspection

Collection, analysis and interpretation of environmental data

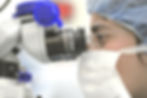
Laboratory testing (where necessary) with full interpretation

Reporting with clear next steps and recommendations

Mould Treatment

Our Approach
We begin by listening to your concerns and reviewing your history, symptoms, and risk factors during our survey. This information guides targeted sampling and analysis, rather than a generic “one-size-fits-all” test.
Our remediation strategies follow internationally recognised decontamination standards, to reduce health risks and help prevent recurrence, delivering solutions that are both effective and sustainable.

Why It Matters
Standard mould treatments often overlook hidden risks. In reality, there are more than 30 different types of contaminants that can affect health, from moulds and bacteria to toxins and particulates.
Attempting to test for everything everywhere would be impractical and costly.
Our focused investigations identify the contaminants most relevant to your symptoms and environment, ensuring accurate, meaningful results that directly support better health outcomes.
What's Included
Decontamination and Risk Reduction
The objective of effective remediation should be to remove the cause of illness, not just to kill mould.
This requires a structured and medically sound process that will reduce your exposure and allow your immune system or treatment to heal you.
We follow internationally recognised procedures to provide varying levels of medically sound treatment, depending on your needs and budget.

Containment and safe removal of contamination

Source control (repairing moisture ingress)

Professional decontamination procedures for air and surfaces

